



 Goal 7. Affordable and Clean Energy
7.2.3. Carbon reduction and emission reduction process: Have a process for carbon management and reducing carbon dioxide emissions
AASTMT has annual plan and procedures for carbon management and reducing carbon dioxide emissions.
Each year carbon footprint is measured and compared to previous’ years emissions to confirm the effectiveness of the pre-set measures to reduce carbon emissions and verify AASTMT progress towards its long-term goal of achieving 50% emission reduction by 2040 which goes in accordance with the national goal towards emissions reduction. Annual related Plans and Progress Reports can be found in the link below.
AASTMT Annual Climate Action Plans and Emissions Progress Reports on AASTMT webpage
Also, annual carbon reduction measures, insights and progress are yearly discussed in Related Annual Plans, Insights and Progress Reports found in the links below.
AASTMT Annual Energy Plans on AASTMT webpage
AASTMT Annual Insights on AASTMT webpage
AASTMT Annual Energy Progress Reports on AASTMT webpage
2024/2025 Process for Emissions Reduction and Climate Action
To support decarbonization within its campuses, AASTMT takes consistent measures that are continuously carried out, besides yearly updated measures which are reflected in carbon emissions reduction among its campuses.
2025 AASTMT measures towards carbon emissions reduction
Measures taken by AASTMT in 2025 to contribute to emissions reduction are discussed in detail in AASTMT 2025 Energy plan
AASTMT 2024/2025 Plan towards Clean Sustainable Energy
as well as in AASTMT 2025-2030 Climate Action Plan found in the link below,
AASTMT Climate Action Plan 2025-2030
These measures can be summarized as;
- Actions towards reducing different Scopes of carbon emissions, including Scope 1 (stationary and mobile combustion and fugitive emissions), Scope 2 (purchased energy, including outsourced cooling) and a wider set of Scope 3 sources: purchased goods and services, capital goods, water and wastewater, fertilizers, staff and student commuting, waste, business travel and leased assets. These actions are as follow,
1. Actions towards Scope 1 emissions (Direct emissions): Reduce emissions from refrigerants and university-controlled fuel use via:
- Refrigerant management: leak prevention and detection, recorded top-ups, and phased replacement of R22 systems with lower-impact alternatives.
- Fuel use: improve the efficiency of generators, boilers and university-controlled vehicles, and log fuel use by source.
2. Actions towards Scope 2 : Implementation priorities towards renewable employment and energy efficiency via:
- Operate and expand on-site PV: maintain the existing grid-connected stations, including those at the Abu Qir and Aswan campuses, restore output wherever it falls, and add feasible rooftop and car-park structures.
- Metered reporting: publish two figures every year — on-site solar generation as a share of total electricity use (PV kWh ÷ total kWh), and the total renewable share including the renewable share of the national grid — with availability, downtime and performance notes.
- O&M excellence: standardize panel cleaning, inverter checks and fault response to maximize output and keep savings.
- Hybrid readiness: evaluate battery storage and other clean options to improve self-consumption and peak management, through small pilots with clear KPIs.
- Connection and safety compliance: keep grid interconnection, protection and permits current for all sites, with single-line diagrams and inspection logs.
- Procurement and design standards: use lifecycle costing, minimum performance ratios, warranty requirements and end-of-life recycling provisions in all new renewable procurement.
- LED persistence: maintain about 95% LED coverage and replace failures like-for-like with high-efficiency lamps and drivers.
- BMS optimization: standardize scheduling, set-points, alarms and occupancy modes across major buildings, with documented quarterly tuning cycles.
- HVAC O&M: coil cleaning, filter regimes, refrigerant leak checks and commissioning of controls to reduce run hours and improve COP/EER.
- Sub-metering and data use: expand electrical sub-meters in high-load areas (HVAC, lighting, laboratories) and use interval data to find and fix anomalies.
- Operational guidelines: after-hours shutdown checklists, plug-load controls and default power-saving settings for IT equipment.
- Projects pipeline: Prioritize measures with clear payback, such as variable-frequency drives on fans and pumps, Economizer fixes and demand-controlled ventilation.
3. Actions towards Scope 3 and sustainable resource management: Divert at least 70% of campus waste from landfill by 2030, reduce total waste generation by 15% before 2030 and become a zero-waste campus by 2049, prioritizing reduction, reuse and high-quality recycling and organics; widen the Scope 3 inventory through:
- Standardized sorting: campus-wide, color-coded bins with clear signage for paper, plastics and metals, glass, e-waste, organics and residual waste, placed in high-traffic and teaching areas.
- Organics program: cafeteria food-scrap collection and back-of-house separation; composting on campus or certified off-site processing with quality controls.
- Paper-use controls: duplex and black-and-white printing by default, digital submissions, paper purchase caps and recycled-content paper.
- Sustainable procurement: requirements for minimal or recyclable packaging, reusable and durable products, and producer take-back for IT, e-waste and laboratory consumables, with end-of-life provisions in contracts.
- E-waste stewardship: secure collection, certified data wiping and documented downstream recycling or repair.
- Water efficiency: routine leak audits, low-flow fixtures where feasible and meter checks.
- Data and logistics: weigh collections by stream and campus, track contamination rates and keep recycler and composter manifests for audit.
- Green commuting: introduce electric or hybrid shuttle buses for staff and students, starting at Misr El-Gedida and Smart Village; provide secure bicycle parking and incentives for cycling and car-sharing; set up a digital ride-matching platform; and work with local authorities to improve public transport to campuses, as recommended by the Carbon Footprint Report 2024/2025.
- Fleet, cooling and refrigerants: assess electrification of the Abu Qir vehicle fleet, improve the efficiency of chilled-water cooling at Smart Village and strengthen refrigerant management at South Valley.
- Sustainable food and wider Scope 3: shift campus catering towards locally sourced, seasonal and plant-based options; reduce staff air travel where alternatives exist; and extend the wider Scope 3 assessment to all campuses by 2027.
- Promote behavioral change among staff and students to reduce energy consumption, foster awareness, and encourage sustainable practices via initiatives, campaigns and workshops.
- Engage postgraduate students and faculty in conducting studies on climate adaptation, carbon footprint and decarbonization in AASTMT campuses, especially the largest AASTMT Alex. campus As per the latter, a study was conducted in 2024 and published in 2025 as shown in the link below.
https://www.sciencedirect.com/science/article/pii/S0973082625001334
This study proposed a roadmap toward total AASTMT – Alex. campus sustainability through four dedicated energy and emissions management strategies-solar rooftop PV installation, electric bus conversion, smart building technology deployment, and biodiesel production from waste cooking oils. These measures theoretically reduce the carbon emissions of CMTT campus by 696.76 tCO2e per year, along with an annual cost-saving of about 87,500 dollars when implemented jointly. Each strategy was studied qualitatively and quantitatively, and the strengths were discovered to differ regarding emissions effects, financial return, and convenience of implementation. The solar PV system creates a perfect impact on emissions, besides the financial argument, while smart building retrofits are quickly paid back. Biodiesel production has a small contribution, yet it has added value of closing resource loop while demonstrating for educational purposes.
- Prioritizing fields of decarbonization and clean energy in 2024/2025 research and graduation projects,
Related AASTMT Research Projects
Related AASTMT Graduation Projects
2024/2025 AASTMT carbon emissions insights
As per Carbon Emissions, calculations were made to evaluate carbon emissions (kg CO2-e) in Alexandria campus for the years 2018 to 2024 as discussed in AASTMT 2024 Energy and Carbon Insights. However, under the direction of the President of AASTMT, a multidisciplinary committee coordinated by the Research and Innovation Center assessed the carbon footprint of four AASTMT branches (Abu Qir, Misr El-Gedida, Smart Village and South Valley) for year 2024/2025, following the GHG Protocol and ISO 14064-1. It covers Scope 1 (stationary and mobile combustion and fugitive emissions), Scope 2 (purchased energy, including outsourced cooling) and a wider set of Scope 3 sources: purchased goods and services, capital goods, water and wastewater, fertilizers, staff and student commuting, waste, business travel and leased assets. This is given by AASTMT Carbon Footprint Report 2024-2025, as well as AASTMT 2024/2025 Insights given by;
AASTMT 2024/2025 Carbon Footprint Report and published at: https://aast.edu/en/about/co2-footprint.php
Table 1 shows total emissions in t.CO₂e in AASTMT Alexandria campus 2019-2024. It is clear that there is continuous reduction in carbon emissions across the years 2019-2024. During this period, reductions were achieved across all three scopes through refrigerant management, about 95% LED lighting, smart building management systems, on-site solar generation, and waste and paper reduction. However, as previously stated, in 2025 the carbon footprint of four AASTMT branches (Abu Qir, Misr El-Gedida, Smart Village and South Valley) is assessed following the GHG Protocol and ISO 14064-1. Compared to 2019–2024 figures which covered AASTMT Alexandria branch campuses; the 2024–2025 figures cover four AASTMT branches and a wider set of Scope 3 sources, including commuting, business travel, food and other purchased goods and services. The breakdown by campus is given by Table 2 and Figure 1.
Table 1. Total emissions in t.CO₂e in AASTMT Alexandria campus 2019-2024
|
Year |
Total emissions (t.CO₂e) |
Change against 2019 |
|
2019 (base year) |
154,594 |
— |
|
2022 |
112,250 |
−27.4% |
|
2023 |
107,075 |
−30.7% |
|
2024 |
103,863 |
−32.8% |
Table 2. Breakdown of Carbon Footprint Report 2024/2025 by campus
|
Campus |
Scope 1 (t.CO₂e) |
Scope 2 (t.CO₂e) |
Scope 3 (t.CO₂e) |
Total (t.CO₂e) |
|
Abu Qir |
2,470 |
4,361 |
10,767 |
17,598 |
|
Misr El-Gedida |
177 |
1,391 |
8,859 |
10,427 |
|
Smart Village |
88.9 |
4,380 |
3,695 |
8,164 |
|
South Valley |
119.2 |
307.8 |
1,637 |
2,064 |
|
Total, four campuses |
2,855 |
10,440 |
24,958 |
38,253 |
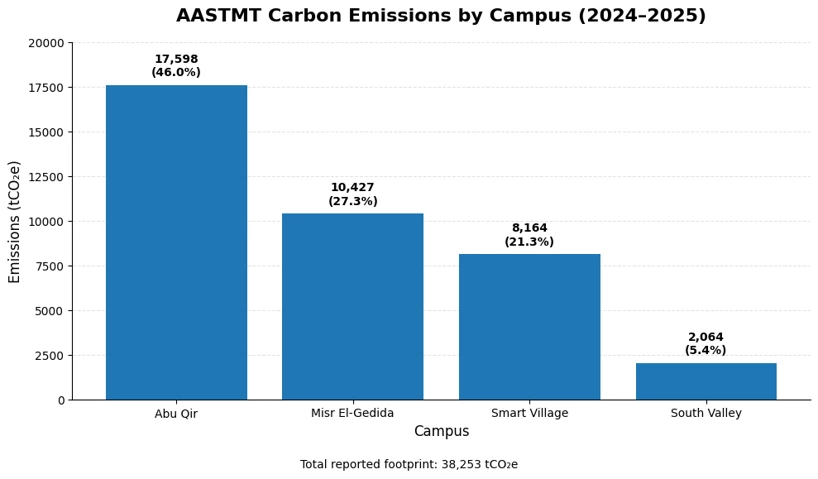
Figure 1. Breakdown of Carbon Footprint Report 2024/2025 by campus
It is worth noting that Scope 3 makes up 65% of the footprint of the four campuses, Scope 2 up to 27% and Scope 1 up to 8%. Emissions are 1.73 t CO₂e per student, below the global average of 2.67 t CO₂e per student cited in the report. The main sources are commuting, the Abu Qir vehicle fleet, outsourced cooling at Smart Village, food at Abu Qir and refrigerant leakage at South Valley. This assessment extends the inventory to a wider range of Scope 3 sources and gives a detailed picture for each campus.
Finally, during period 2025-2030, AASTMT has put a Climate Action Plan 2025-2030, intending to extend this wider assessment to all its campuses based on GHG Protocol and ISO 14064-1. AASTMT measures towards reducing Scope 1, 2 and 3 emissions will be assessed annually given the baseline measured in 2025, to make sure the 2025-2030 plan is progressing each year.
AASTMT Climate Action Plan 2025-2030
2023/2024 Process for Emissions Reduction and Climate Action
To support decarbonization within its campuses, AASTMT takes consistent measures that are continuously carried out, besides yearly updated measures which are reflected in carbon emissions reduction among its campuses.
2024 AASTMT measures towards carbon emissions reduction
Measures taken by AASTMT in 2024 to contribute to emissions reduction are discussed in details in AASTMT 2024 Climate Action Plan as well as AASTMT Carbon Emissions Reduction and Sustainability Progress Report (2024).
AASTMT Climate Action Plan_2024
AASTMT Carbon Emissions Reduction and Sustainability Progress Report (2024)
These measures can be summarized as;
1. Regular Measures
- Conduct regular assessments of carbon emissions to implement strategies for reduction.
- Proceeding with the comprehensive recycling program implemented across all campuses, targeting paper, plastic, and electronic waste
- Consistent and expanded use of digital platforms to reduce paper consumption.
2. AASTMT 2024 Process
- Different Scopes of emissions are tackled in 2024 as follows,
Scope 1 (Direct). Scope 1 covers emissions from university-controlled sources, principally refrigerant leakage from HVAC/refrigeration systems and fuel use in university-controlled equipment/vehicles. Thus, in 2024, Scope 1 is to be reduced by applying tighter refrigerant management and continued operational efficiency measures.
Scope 2 (Purchased electricity). Scope 2 accounts for emissions from grid electricity used by AASTMT. AASTMT efforts focuses on operational optimization and energy efficiency upgrades—when ~95% of conventional lighting had been replaced with LED and smart building management systems (BMS) had been deployed across major buildings. In 2024, teams prioritized BMS tuning (scheduling, set-points, and alarms), targeting HVAC, and light controls in high-use spaces.
Besides, full dependence on about 230kW on-site solar output to lower grid dependence is achieved in 2024. This includes 150kW grid-tied PV station in AASTMT Aswan branch and 50kW grid-tied PV station in AASTMT Alex. Abukir campus, both feature net-metering systems as well as solar heaters in Pharmacy college and Students’ dorms in AASTMT Alex. Abukir branch. This is detailed in
AASTMT 2024 Plan towards Clean Sustainable Energy
Scope 3 (Selected categories). Scope 3 remains the largest share and includes waste, water, paper, and transmission & distribution (T&D) losses associated with purchased electricity. In 2024, AASTMT plans to implement measurable waste minimization targets and standardized protocols for sorting and collection across campuses, including: (i) expanding labeled collection points in high-traffic areas, (ii) reinforcing operating procedures with facilities teams, and (iii) running term-start refreshers for staff and students.
- Promote behavioral change among staff and students to reduce energy consumption, foster awareness, and encourage sustainable practices via initiatives, campaigns and workshops.
- Engage postgraduate students and faculty in conducting studies on climate adaptation, carbon footprint and decarbonization in AASTMT campuses, especially the largest AASTMT Alex. campus
As per the latter, a study was conducted in 2024 and published in 2025 as shown in the link below.
https://www.sciencedirect.com/science/article/pii/S0973082625001334
This study proposed a roadmap toward total AASTMT - Alex campus sustainability through four dedicated energy and emissions management strategies-solar rooftop PV installation, electric bus conversion, smart building technology deployment, and biodiesel production from waste cooking oils. These measures theoretically reduce the carbon emissions of CMTT campus by 696.76 tCO2e per year, along with an annual cost-saving of about 87,500 dollars when implemented jointly. Each strategy was studied qualitatively and quantitatively, and the strengths were discovered to differ in regard to emissions effects, financial return, and convenience of implementation. The solar PV system creates a perfect impact on emissions, besides the financial argument, while smart building retrofits are quickly paid back. Biodiesel production has a small contribution, but has added value of closing the resource loop while demonstrating for educational purposes.
- Prioritizing fields of decarbonization and clean energy in 2024/2025 research and graduation projects.
Validation of 2024 AASTMT measures towards emissions reduction
As per Carbon Emissions, calculations were made to evaluate carbon emissions (kg CO2-e) in Alexandria campus for the years 2018 to 2024 as discussed in 2024 AASTMT Insights Report
AASTMT 2024 Energy and Carbon Insights
Table 1 presents the emissions across Scope 1, Scope 2, and Scope 3, as well as total carbon emissions, within the period 2018-2024, while Fig. 2 zooms into emissions insights within 2021-2024. Using the Greenhouse Gas Protocol's framework, insights are provided into direct and indirect emissions, to identify key areas for improvement. Scope 1 emissions, which encompass direct emissions from university-controlled sources, include fuel usage for the campus transport fleet and emissions from refrigerant leaks in air conditioning and refrigeration systems. On the other hand, Scope 2 emissions arise from indirect emissions due to purchased electricity, while Scope 3 emissions account for indirect emissions from activities as waste disposal, water usage, and paper consumption.
Analyzing these emissions insights, it is concluded that by year-end 2024, AASTMT’s total carbon footprint is 103,862,750 kg CO2-e, a further −3.0% from 2023’s 107,075,000 kg kg CO2-e. Against the 2019 base year (154,594,380.99 kg CO2-e), this equates to a −32.8% reduction—keeping AASTMT comfortably on track to maintain the ≥30% reduction by 2025 required by the Climate Action Plan and aligned with the longer-term −50% by 2040 goal.
Reductions were achieved across Scope 1, Scope 2, and Scope 3, driven by improved refrigerant management, energy-efficiency upgrades (including the 2023 LED/BMS program), incremental on-site solar generation, and continued waste and paper minimization. Consistent with the published series, Scope 3 remains the dominant share while showing gradual improvement due to resource-efficiency measures and procurement practices as discussed in details in 2024 AASTMT Carbon Emissions Report.
2024 AASTMT Carbon Emissions Progress Report
Table 1: AASTMT-Alexandria campus- Carbon Emissions from 2018 to 2024 (kg CO2-e)
|
Year |
Scope 1 (kg CO2-e) |
Scope 2 (kg CO2-e) |
Scope 3 (kg CO2-e) |
Total Emissions (kg CO2-e) |
|
2018 |
1,244,230.50 |
1,240,286.52 |
98,997,739.78 |
101,482,256.80 |
|
2019 |
1,374,252.42 |
1,151,281.20 |
152,068,847.38 |
154,594,380.99 |
|
2020 |
972,551.04 |
869,471.36 |
87,130,328.87 |
88,972,351.27 |
|
2021 |
1,561,942.92 |
1,008,256.20 |
112,858,633.63 |
115,428,832.75 |
|
2022 |
1,300,000.00 |
950,000.00 |
110,000,000.00 |
112,250,000.00 |
|
2023 |
1,150,000.00 |
925,000.00 |
105,000,000.00 |
107,075,000.00 |
|
2024 |
1,092,500 |
897,250 |
101,873,000 |
103,862,750.00 |
